
Understanding statistics
The statistics view shows how your ads perform in the selected period. It helps you see whether ads are being viewed, saved and enquired about.
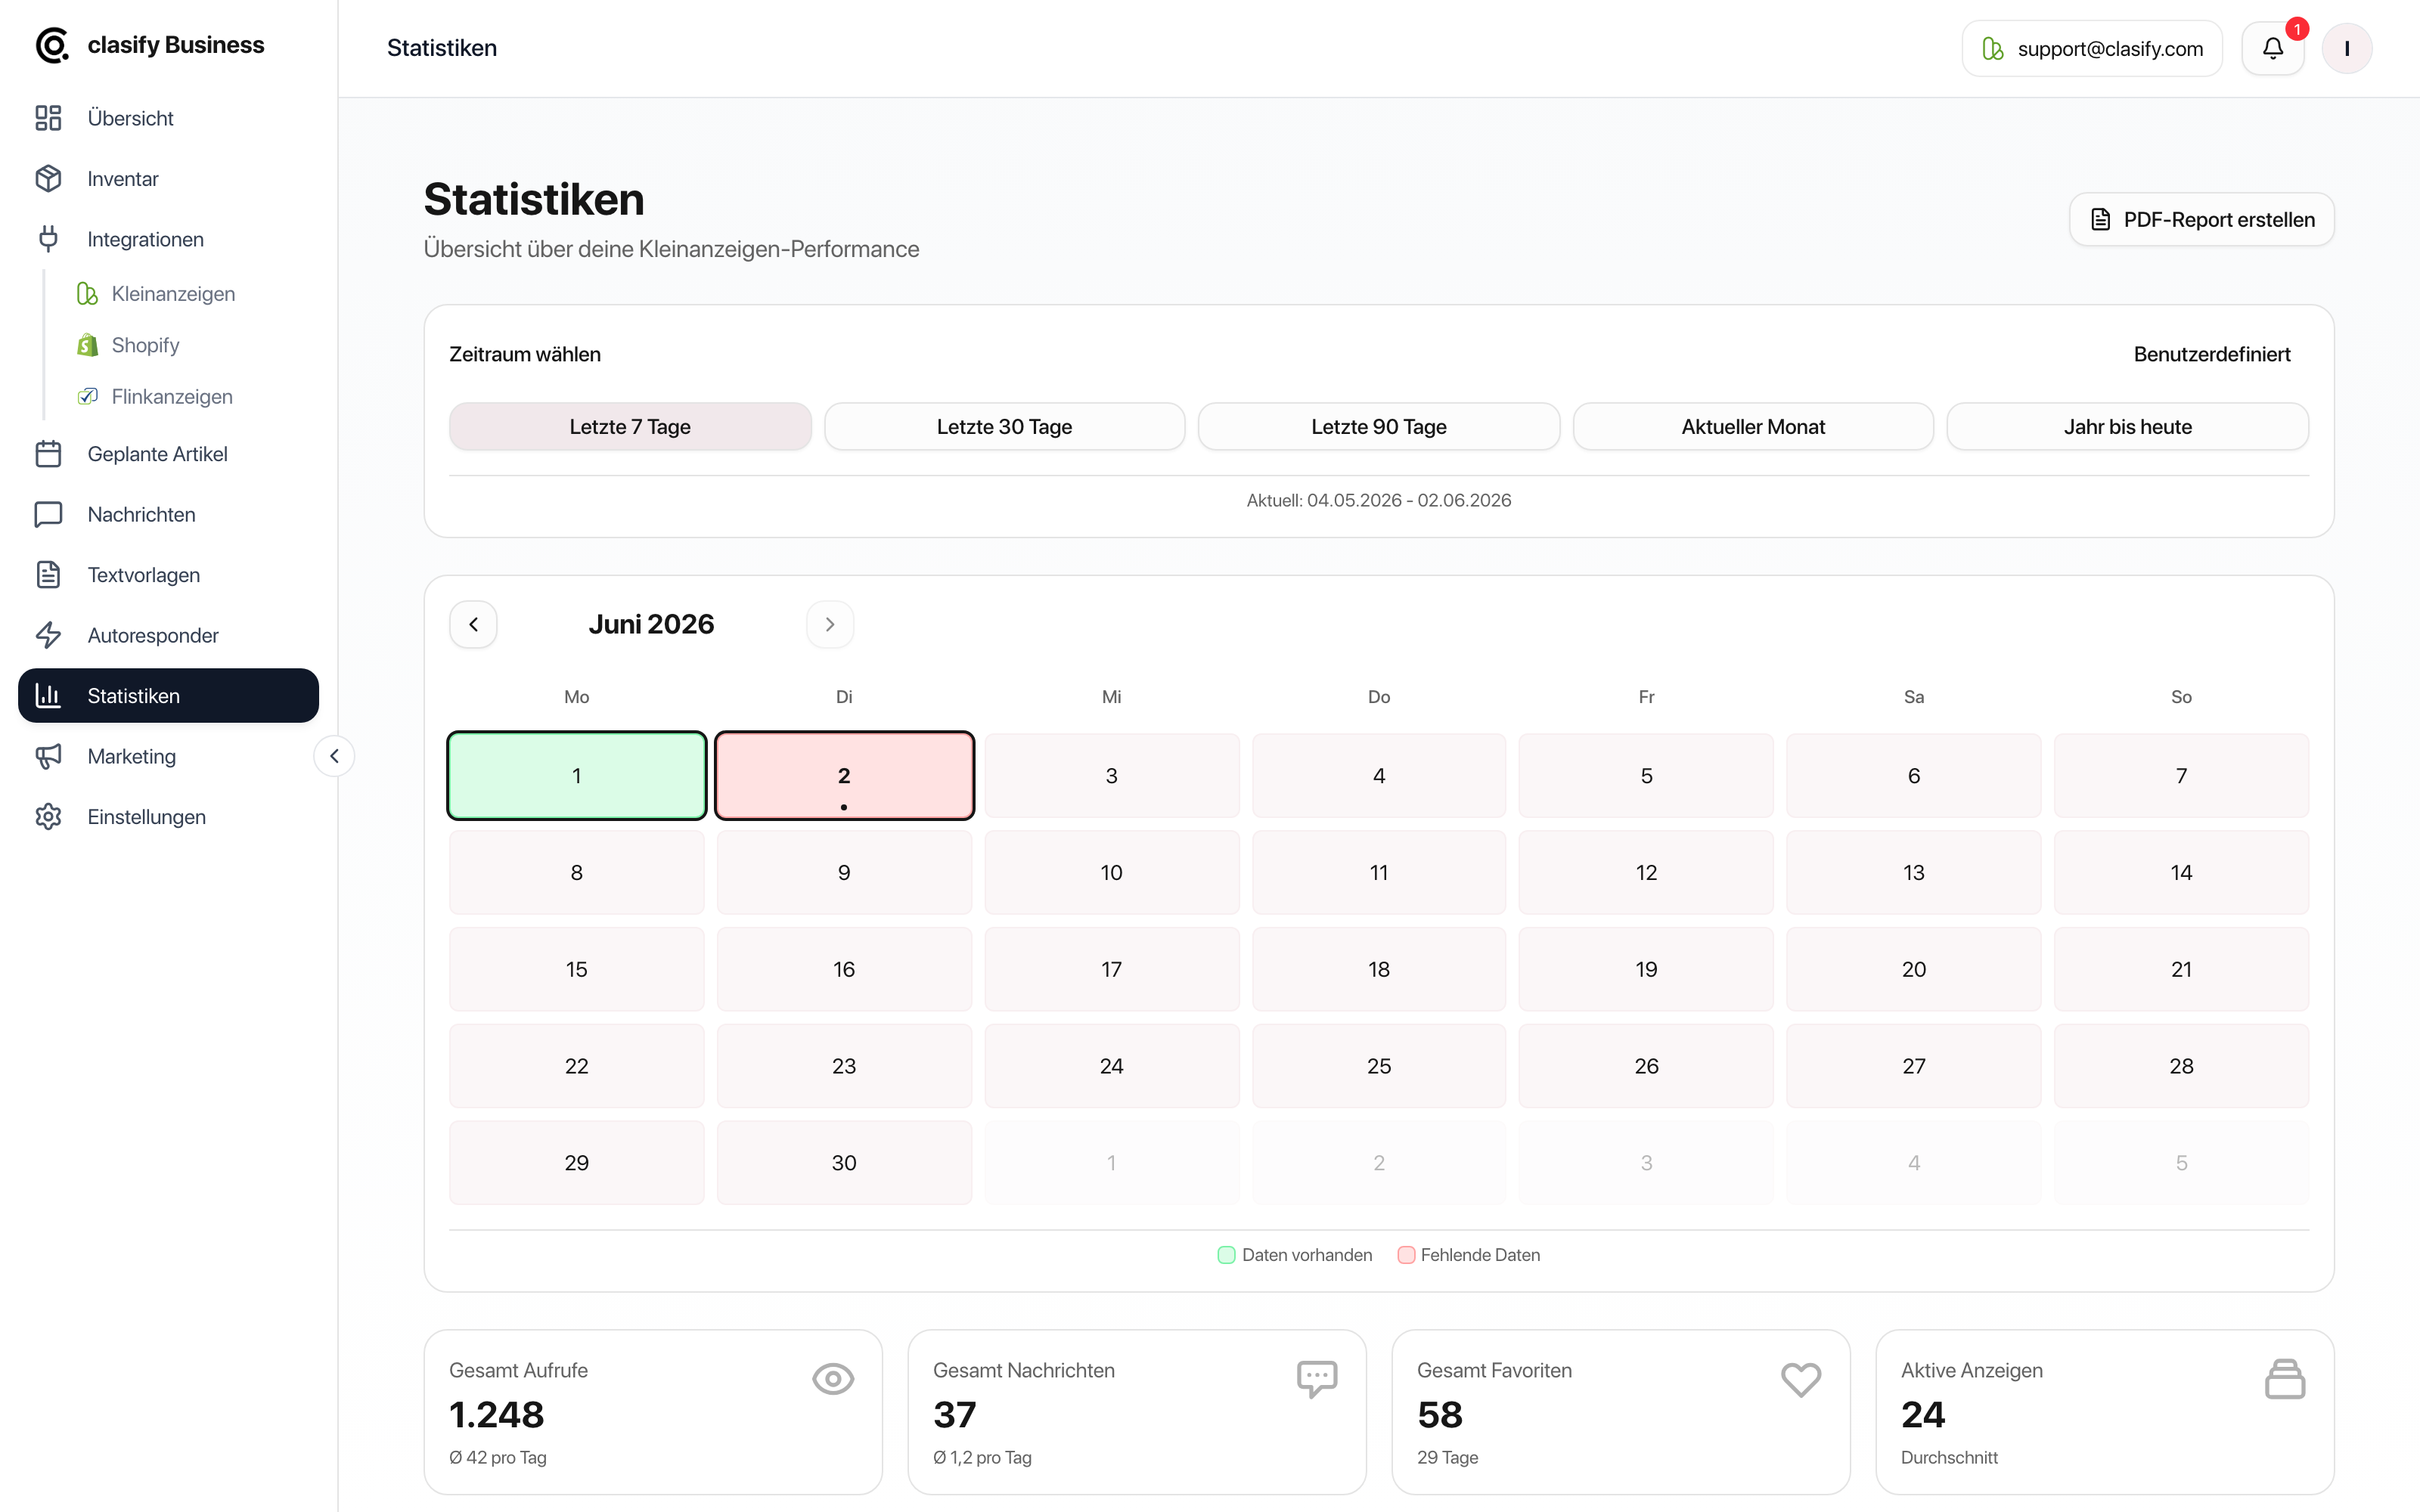
Select a period
Section titled “Select a period”-
Open Statistiken (Statistics).
-
Select the period you want.
-
In the calendar, check which days have data.
-
Read the overview cards first.
-
Then compare the development in the trend chart.
Key metrics
Section titled “Key metrics”- Gesamt Aufrufe (Total views): How often your ads were viewed.
- Gesamt Nachrichten (Total messages): How many direct enquiries came in.
- Gesamt Favoriten (Total favorites): How often ads were saved.
- Aktive Anzeigen (Active ads): How large your active ad inventory was in the period.
- Follower and profile values: Indications of how your seller profile is perceived.
These values refer to your connected Kleinanzeigen.de account.
Read trends
Section titled “Read trends”The trend chart shows the development over several days. You can show or hide individual curves, for example views, messages, favorites, ads or followers.
Examples:
- Many views, but few messages: check price, description or images.
- Few views: check category, title, publication time or ad status.
- Many favorites, but no messages: check price negotiation or a clearer description.
- Sharp drop: check whether ads were paused, deleted or are no longer current.
Reload data
Section titled “Reload data”In the calendar you can select individual days and have them reloaded. Use this when data is missing or when you want to pull in current values after a major change.
If no data is visible yet
Section titled “If no data is visible yet”Statistics do not always appear immediately. They are collected regularly. If you have only just started, wait until data is available for your ads.
PDF report
Section titled “PDF report”If the report is available for your account, you can create a PDF report from the statistics. It is mainly intended for evaluations, customer reports or internal meetings.